Monitor Cluster Components
In this tutorial we will discuss about Monitor the Kubernetes cluster components.
So how do you monitor resource consumption on Kubernetes? or most importantly what would you like to monitor?
I would like to know, node level metrics such as the number of nodes in the cluster, how many of them are healthy as well as performance metrics such as CPU, memory, disk and network utilization.
As well as POD level metrics such as the number of PODs, and performance metrics of each POD such as CPU, memory consumption on them.
So we need a solution that will monitor these metrics store them and provide analytics around this data.
As of this tutorial, Kubernetes does not come with a full featured built-in monitoring solution.
However, there are a number of open-source solutions available today, such as the Metrics server, Prometheus, Elastic stack, and proprietary solutions like OpsRamp, Datadog and dynatrace.
Heapster vs Metrics Server
Heapster is the one of the original projects that enabled monitoring and analysis feature for Kubernetes.
You will see a lot of reference online when you look for reference architecture on monitoring Kubernetes.
However, Heapster is now deprecated and a slimmed down version was formed known as the Metric Server.
You can have one metrics server per Kubernetes cluster. The metric server retrieves metrics from each of the Kubernetes nodes and PODs, aggregates them and stores them in memory.
Note that the metric server is only an in-memory monitoring solution and doesn’t store the metrics on the disk and as a result you cannot see historical performance data.
For that you must rely on one of the advanced monitoring solutions we discussed earlier in this tutorial.
So how are the metrics generated for the PODs on these nodes?
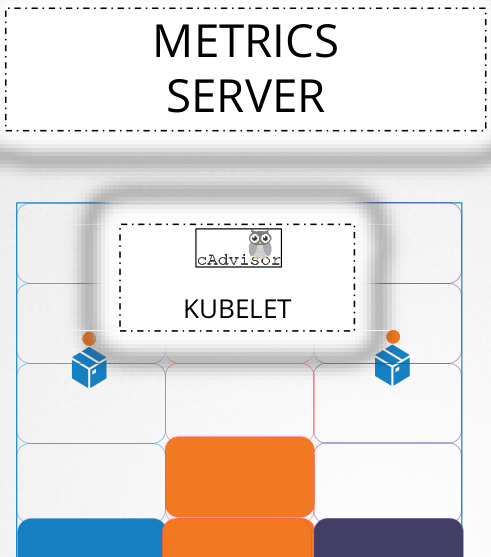
Kubernetes runs an agent on each node known as the Kubelet, which is responsible for receiving instructions from the Kube API Server and running PODs on the nodes.
The Kubelet also contains a sub component known as cAdvisor or Container Advisor. cAdvisor is responsible for retrieving performance metrics from PODs, and exposing them through the Kubelet API to make the metrics available for the Metric Server.
If you are using minikube for your local cluster, then run the following command.
$ minikube addons enable metrics-server
For all other environments deploy the metric server by cloning the metric server deployment files from the git hub repository and then deploy the required components.
Once Metric Server processed cluster performance can be viewed by following command.
$ kubectl top node
NAME          CPU(cores)   CPU%   MEMORY(bytes)   MEMORY%
kube-master    1032m        12%    2917Mi          47%
kube-node-01   540m         5%     1897Mi          27%
kube-node-02   102m         2%     1012Mi          11%
This provides the CPU and Memory consumption of each of the nodes. Use the following command to view performance metrics of PODs in Kubernetes.
$ kubectl top pod
NAME                          CPU(cores)   MEMORY(bytes)
redis                         5m           25Mi
nginx                         9m           52Mi